Energy Burden: How To Measure? How To Reduce?
I was introduced to the concepts of “energy burden” and “energy poverty” through my participation in the Energy Waste Reduction workgroup of the Michigan Public Service Commission. This was many moons ago, and since this time, I’ve followed the issue pretty closely, and written about it a bit. It’s a huge determinant of economic welfare at a household level. In short, energy burden is the measurement of how much of a household’s income is spent on utility bills. This is especially an issue in the heating climates of the great postindustrial north and it has massive implications for economic and racial justice, not to mention climate change (n.b. frigid winters in Rust Belt cities with majority Black populations). It’s something that has also come up a lot in Maryland and DC, two jurisdictions that, as I’ve written before, take this whole utility regulation thing a lot more seriously than we do in Michigan. But, while the topic of “low to moderate income” isn’t new, tracking energy burden– and figuring out how to cost-effectively reduce it- is a relatively new concept.
Better Utility Regulation: How We Can Get Out Of This Mess
The What: Definitions and Challenges Thereof
A household’s energy burden is defined as the percentage of income that it spends on utilities. There’s no hard-and-fast rule about what “utilities” includes, but it generally includes energy, so, electricity and gas, if applicable. This doesn’t include water (although water bills in plenty of jurisdictions are crazy high). You’re “supposed” to spend less than 6% of your income on utility bills– with that “should” defined as a matter of the number above which things start to get dicey for the average consumer as far as having to make decisions between living in a comfortable temperature and perhaps eating. There are also not really firm definitions around what this number is actually supposed to look like. Some sources say that the average spend is around 3%, while low-income households spend an average of 8.6%.
There are a few nice things that about using the metric of “all energy, don’t make no nevermind what type of energy. It makes it easy to consider energy burden as an absolute feature of household spending, irrespective of a number of variables that will substantially complicate the question of how to fix it. In general, climates with high numbers of cooling degree days (CDD)– a.k.a. hotter, more humid climates- tend to use more electric heat than gas or other kinds of heat, because infrastructure for gas distribution is probably more limited since heating is less vital. Hotter climates also use a bunch more air conditioning, which sucks, because most air conditioners are really, really inefficient.
Noted one report from the Energy Information Administration:
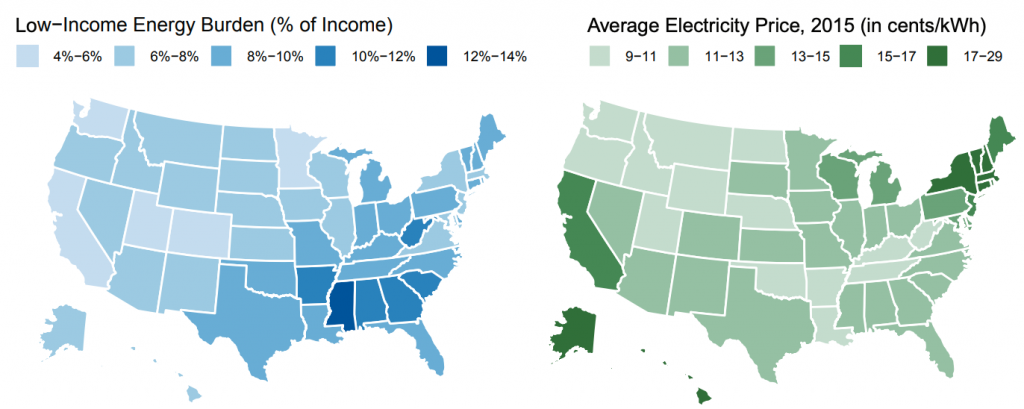
In the five states with the highest low-income energy burden— Mississippi, South Carolina, Alabama, Georgia, and Arkansas— low-income households use 36% more electricity than the low-income national average. In these states, electricity is the dominant heating fuel and high air conditioning demand also contributes to high consumption.
Electrification, But Not Like That
For one, electricity, at least in terms of electrical resistance heating, is very expensive to use to heat your home, because of the percentage points lost from transmission of the electricity over a long distance to get to your home, and, far more significantly, the thermodynamic inefficiencies at the power plant generating the electricity to start with. Power plants are really good at generating a lot of power. But it turns out they’re not very efficient. In comparison, fossil gas and fuel oil are relatively efficient at storing energy, and home heating appliances can be very efficient at burning them.
Compare a gas furnace burning at 96% efficiency compared to, say, an electrical heater that, while nominally around 99% efficient, has already lost more than two thirds of the actual energy involved by the time it reaches your house. Yes, people. A full two thirds of the coal we burn literally goes up in smoke. Really inefficient. Anecdotally? I have seen exactly two electrical resistance furnaces in my time in the Great Northern States, and both were used as supplemental space heating in rooms where no gas lines existed– but where ample electric supply existed. Baseboard electric heating is much more common, especially in the mixed-humid climates of the Southeast to the Midatlantic. The idea is that we have enough electricity, so, might as well use it! Of course, this isn’t the case in increasingly extreme temperatures and increasingly strained grids.
Reducing Energy Burden As Economic Justice & Climate Solution
Simplified: we need to figure out how to reduce the energy burden of households that have a high energy burden. This isn’t, as one of my colleagues at another company (that shall not be named) complained, “social welfare.” It’s a way to decarbonize the economy while also increasing customers’ ability to pay their bills. That’s a good thing. Lower utility bills means fewer delinquencies and arrearages.
It also means more money for households to spend on other stuff. Like buying things people need. Oh, the other thing? If utilities charge a surcharge on every kilowatt hour or cubic foot of gas sold, as most energy efficiency programs are indeed funded, they are able to recoup the money they spend at a predictable, respectable, fixed rate of return. In other words, we earn a rate of return to make things better for everyone and to reduce our carbon footprint.
Utilities looking at this question can assess the issue through a variety of metrics. Something that has come up in the workgroups– including Pepco (Exelon), Potomac Edison (not to be confused with The Potomac Electric Power Company, a.k.a. Pepco), SMECO, Washington Gas, and other utility companies operating in Maryland- is the challenge of tracking energy burden because of the need for income verification. Utilities correctly point out that this is onerous and labor-intensive to collect.
The Challenge of Reliable Measurement
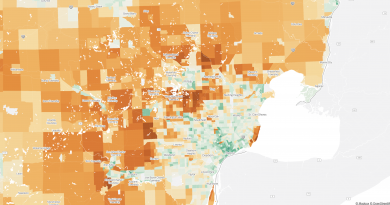
We can use census tract data as a proxy for income. But in order to actually demonstrate a reduction in energy burden, we need to be able to compare before-and-after numbers. This is complicated for a few very pesky reasons that, to date, no one has figured out how to crack. The following factors complicate assessment of energy burden and have to be controlled for in an effective analysis (barring a very large sample):
- Renting vs. owning. Owners have a clear incentive to reduce their energy usage. Renters do, too, but they have to deal with the intermediary of the landlord. There is a thing called the “split incentive.” If a utility provides a rebate for work that adds value to a rental unit, does the landlord pass that value through to the renter? Does the landlord realize the appreciated value of the asset and try and jack up the price of rent? Can we control for this?
- Appliance configuration in a household. This can drastically shift energy usage metrics. DTE sends us friendly reminders every month that we use way more energy than our neighbors. We have a dishwasher that we run daily. We have a mini-fridge and five people who own and operate a lot of electronics in the age of work-from-home and its multiple monitors. Most significantly, we have an electric dryer— and four window AC units that run frequently in the warmest months. Plus a mini-split. A couple hundred watts times a bunch of different things adds up real quick.
- Number of occupants in a household. See above!
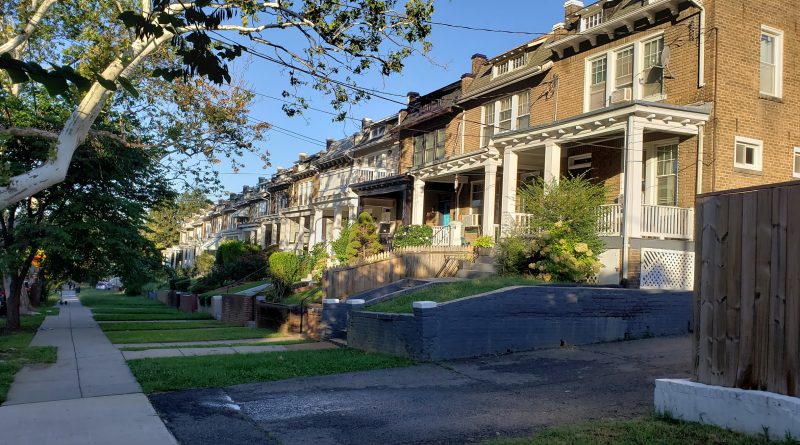
- Density of a building (how many units). This substantially affects the efficiency of a unit. A regular box of a house has a minimum of five sides exposed to the elements, which has implications for conductive losses (thermal envelope) as well as convective losses (wind and air leakage, a.k.a. pressure boundary). A duplex immediately loses one of those sides for each unit because they share a wall. In a triplex, where three units are lined up in a row, the center unit is only exposed on three sides (roof, front, rear), but the units on the ends are exposed on four sides. Think about this in terms of row houses. In a large, multifamily building, a building might have only one “face” exposed to the exterior. There is no hard-and-fast rule about how to analyze this or control for it.
- Architectural condition of a building. Older buildings may be in much worse shape than newer, code-built buildings. But they may also involve other complicating factors. An old house with foot-thick brick walls likely is far leakier than a new build, but also may have a lot of thermal mass– that can keep the inside cool for longer on a hot day, or warmer on a cold day. Also, even an old, poorly insulated, leaky house might outperform a new one in terms of gross energy usage if the new one has central air while the old one relies on just one or two window units!
We in the utility world are kicking around the idea of figuring out a way to create a robust, but simple enough, statistical analysis to sample units that have had work done. The challenge is controlling for the above variables.
The Policy How: Reducing Energy Burden
So, as in most of my posts: How do we fix it? There are different levels of support. One basic solution begins in the form of cash transfers to low-income ratepayers: LIHEAP is the bandaid, slapping-sticker-on-a-leaking-tank-of-water-meme solution that a lot of policymakers seem to think is a great idea. As I’ve written in the past, LIHEAP effectively amounts to a direct taxpayer subsidy to fossil fuel consumption. We have a lot of evidence that cash transfers are effective ways to lift people out of poverty. But this is only true in programs like the PUA, EBT, or other programs that facilitate consumer discretionary spending.
Utility spending is not the same, though. The expectation of a large required spend on utility bills is unfortunately baked into especially lower-income market segments, and even more so in regulatory climates where utilities aren’t required to invest in much other than their shareholders.
To quote a rather obnoxious gentleman I used to work with, and I apologize for using this quote again: “You know, Nat, I was paying $600 a month to heat that house, and I don’t think there was a single thing I could have done to reduce that number!” This illustrates how we need to move beyond simply subsidizing an expense that many consumers feel is inevitable. We need to develop a culture of conservation to make this whole “climate change mitigation” thing work.
The Sexy: Technology
The “electric heating is bad” calculation mostly evaporates when you think about heat pumps, which allow us to avail ourselves of the sorcery of thermodynamics. Every watt of input produces a few watts of equivalent energy output. This is thermodynamically possible because of a thing called refrigeration. Expansion, contraction, Carnot cycle, blah blah blah. I wrote a whole thing about it, so you can check that out.
The Unsexy: Building Envelope Retrofits
Utilities don’t generally mess with these for a few specific reasons. In general, utilities don’t spend too much effort on things that don’t directly affect load. This is why your utility will give you rebates on things like lightbulbs or thermostats, but not so much for insulation. Cynically, utilities want load to grow, so they don’t have an incentive to invest in insulation that makes your house more efficient. However, most utility energy efficiency programs deliver a fixed rate of return to the utility, so it’s actually profitable to invest in these programs. This varies by jurisdiction and by utility, certainly. It’s also majorly determined by how states regulate utilities.
The average building built outside the past, say, ten years, needs a lot more insulation. New buildings built to code may well be quite efficient.
In addition to more technological measures, the term “weatherization” may cover:
- Air sealing for windows and doors (obnoxious and tricky but can have a substantial impact).
- Insulation retrofits in attics.
- Wall insulation (interior) or exterior-applied insulation.
- Roof replacements with attention to superior insulation.
- Deep retrofits– like aggressive air sealing with spray foam. Or slab insulation.
Think Both Inside And Outside The Box.
Solving these issues requires both policy and technical interventions. Some of these are fundamentally technological (more efficient HVAC). Others are more matters of fixing air leaks and improving insulation. Both are necessary. Hopefully, the second comes before the first.
It’s important for us to continue to advocate for better policy to fund these things. Energy efficiency delivers a pretty whopping return on investment between job creation and local economic product, consumer savings, and improved occupant health. But measuring reductions in energy burden remains a somewhat elusive thing– and one I hope to work on solving in the near future.

