
So, How Flat IS That Curve, Anyway?
Spring is sprung, at long last. In most northern American cities, cabin-febrile residents have taken to the streets– whether to burn effigies of their governor or simply to enjoy the warm weather. But hey– what ever happened to that whole curve we were supposed to flatten? Did we, uh, flatten it?
First off, I’m a city planner, not an epidemiologist. I do, however, enjoy a good spreadsheet. I’m also a semi-literate journalist, so I can read things and, on occasion, understand them. So, it’s been a little bit dismaying to track COVID stats while hearing about how entire states are reopening their economies while, well, the numbers suggest that it’s still probably a terrible time to do that.
The first chart below shows three lines. The blue line is the total cumulative number of cases in the United States, while the orange line represents the new daily cases. The grey line represents deaths over a five-day simple moving average. I used a five-day simple moving average (SMA) because the death rate seems to oscillate wildly based on a vaguely weekly pattern, something I couldn’t quite explain. (Twitter consensus is that it probably has to do with hospital bureaucracy and patient admittance). Interestingly, in the past couple of days since I wrote this article and the time of publishing it today, I’ve noticed that perhaps the comprehensive coronavirus tracker has added an SMA to its charts.
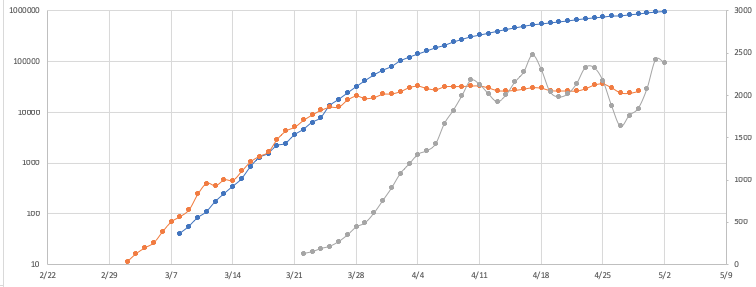
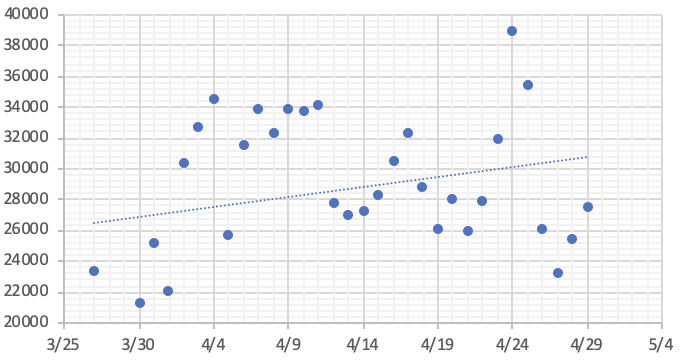
As evidenced by the orange line, the curve has been flattened. Circa March 28th, the number of new daily cases seems to plateau. But the number of new cases diagnosed per day has not decreased, as shown in the scatterplot below.
If we infer from the weekly variation in the death counts that the same is true for new daily case counts, we might try and see what happens to the scatterplot when we eliminate the most extreme, recent data points. But even eliminating these five days in the past two weeks that cracked the 30,000 mark, it’s still a gentle, upward slope. In other words, the rate of infection appears to be slowly increasing, however you want to slice it.
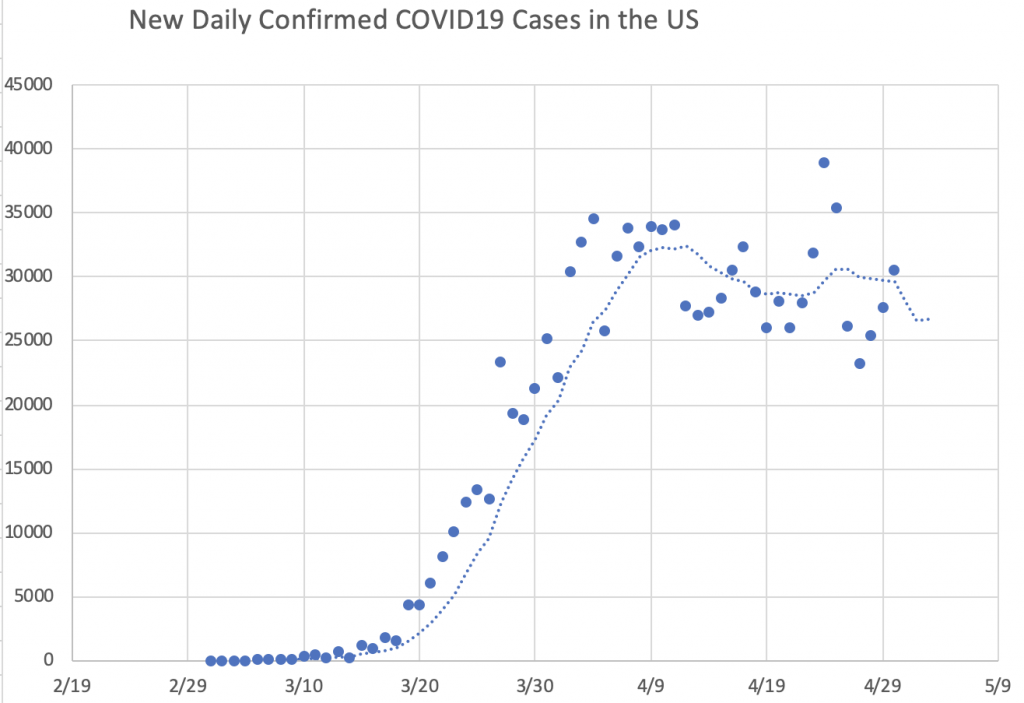
Of course, it’s possible to manipulate graphs. With a polynomial trend line over a seven-day period, the curve looks like it peaks around 4/10 and then declines a bit.
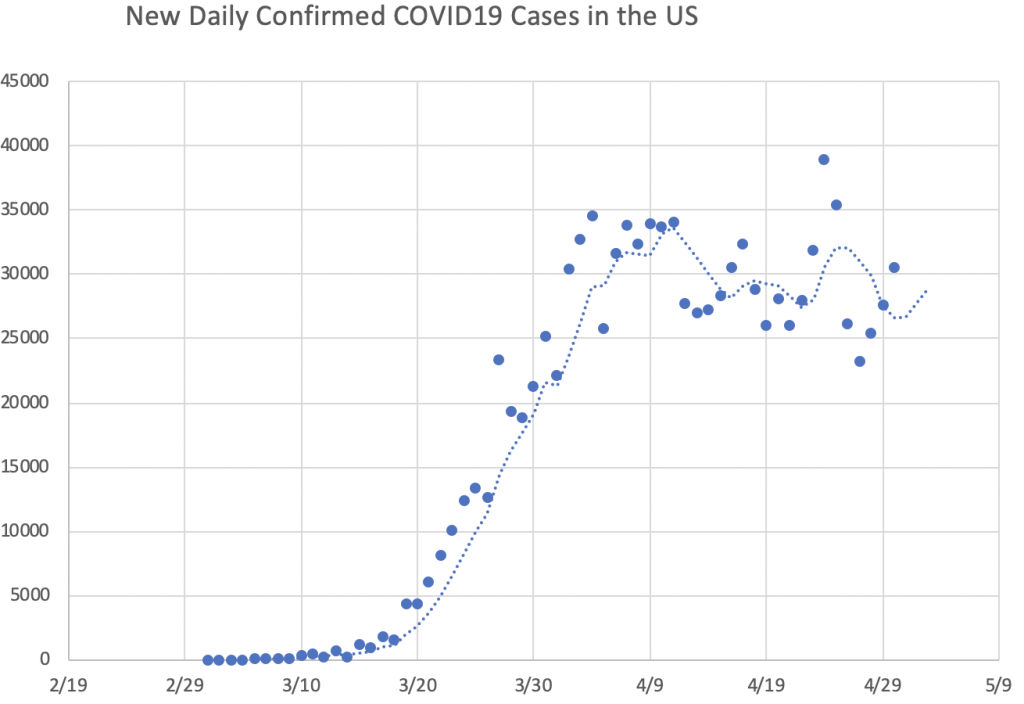
But when you use a 5-day instead of a 7-day, the graph looks like it’s trending up. There is a further complication of geographic disparity. Infection rates have been reduced greatly in hard-hit cities like New York or Detroit, where policymakers adopted aggressive shutdown measures, but rural areas are now seeing spikes.
In short, reports of COVID19’s demise are greatly exaggerated. Flattening the curve is a great thing. But rethinking the re-openings is probably prudent.
Good luck convincing some of These People in the “Live Free or Die? Por que no los dos?!” camp.