

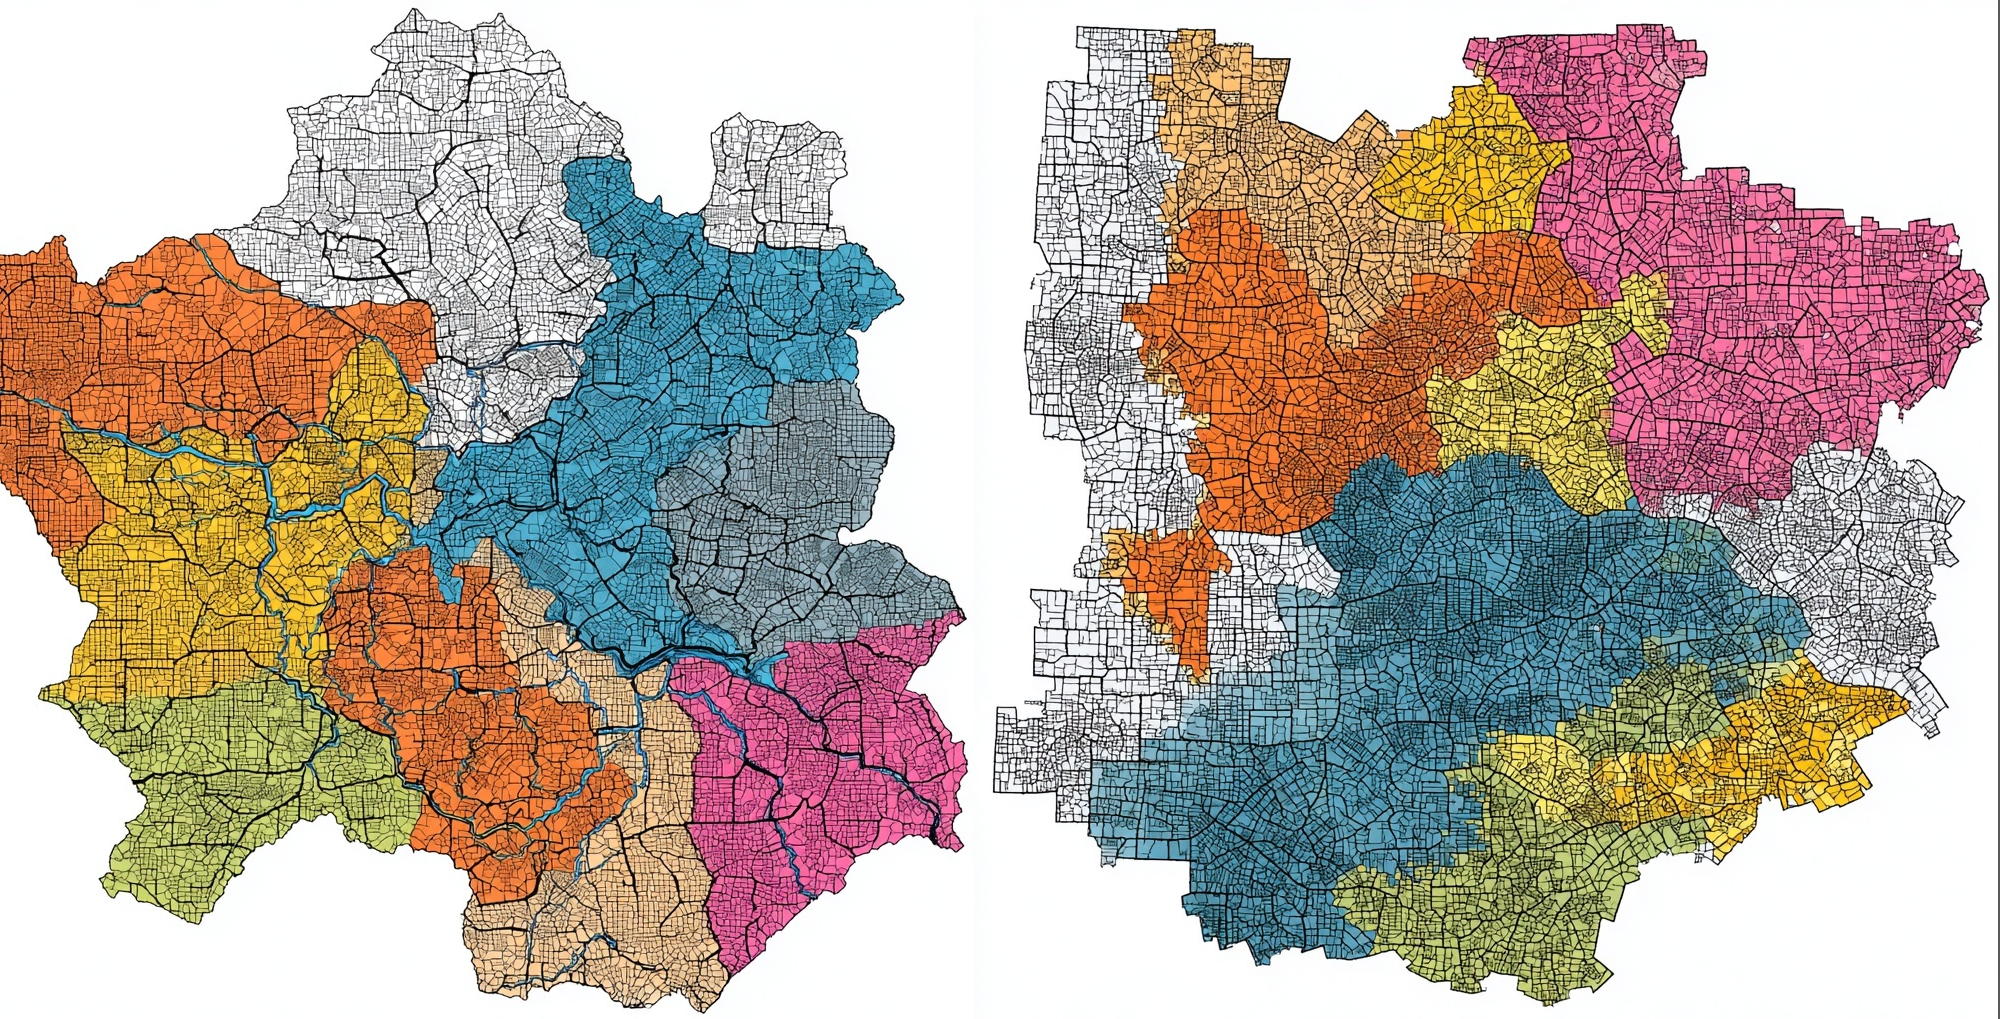
Imagine, if you will, a Venn diagram. It includes two circles. The first is people screaming about how dangerous Washington, DC is, while cheering on Donald Trump’s deployment of National Guardsmen to the city to combat an invented crime emergency after Edward “Big Balls” Coristine allegedly got his ass whooped. The second circle of our Venn diagram involves people who point to an electoral map that shows voting by county, and are incredulous that Democrats could ever win, seeing as the blue is clustered in heavily urbanized counties. This Venn diagram is but a perfect circle. And it’s because people don’t understand the spatial geometry of these arbitrary little things called borders.
Let’s unpack this.

The Modifiable Areal Unit Problem
There’s this thing that dogs urban planners, statisticians, and others, and it’s the question of how to draw boundaries on maps for the purpose of analysis. Statistics often looks at data along an X and a Y axis, but in a spreadsheet.
The modifiable areal unit problem (MAUP) is really one of spatial statistics, in which we’re using things like chloropleths (maps that color-code things like counties based on how much whatever they have) to visualize a certain problem and, we hope, answer a certain question. The problem has been well-known for a long time.
Solving it, though, is kind of complicated. Expanding an area of study, for example, can create problems. And changing the area of study will always raise a question of why it was changed, and why it was changed in that particular manner.
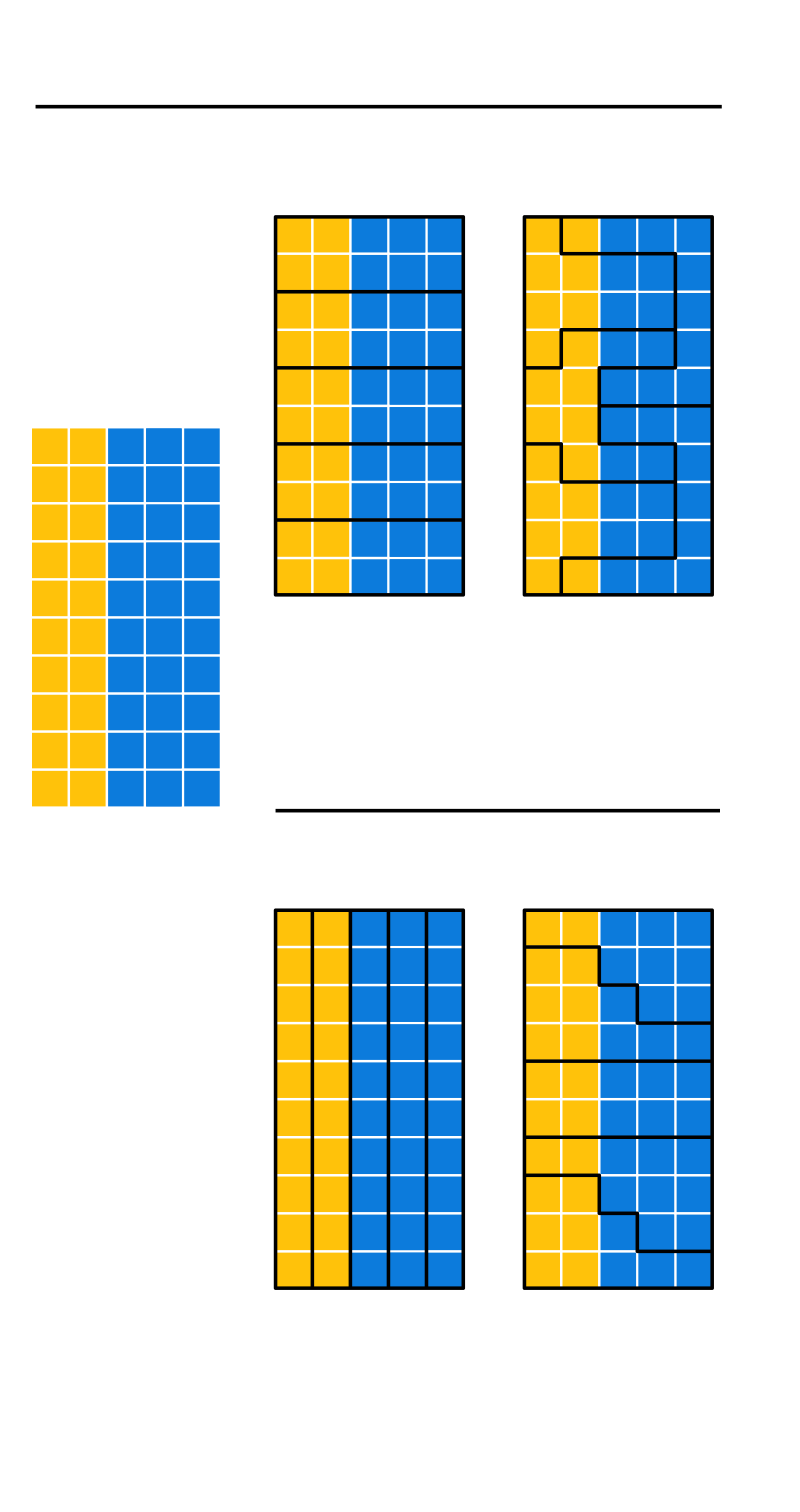
Perhaps the most common illustration of the MAUP is a little thing that’s been in the news recently called gerrymandering, which involves intentionally drawing political boundaries to advantage a minority group, to entrench an existing advantage of a minority group, or to enable a sort of insurmountable control of a majority group.
Gerrymandering Crime?
Well, sort of. What’s weird about DC is that it’s constrained by, variously, a river (separating it from Virginia), and by generally weird diagonal boundaries that bisect most of the city’s urban fabric. You can walk from DC into Maryland in most parts and not have any idea– except for the (odd) diagonal street separating the city from its suburbs.
DC is, of course, already quite suburban in some of the areas where it borders Maryland. A normal city would have been able to annex those municipalities as it grew. DC is constrained to its neat little diamond with the Virginia slice taken out (and that, as they say, is a whole ‘nother story!). DC’s spatial constraints are, in fact, written into the Constitution itself (not that this administration is paying much attention to that old thing anyway these days, right?!).
If DC could annex even a few of its inner-ring suburbs, it would drastically shift the crime numbers. And the property tax revenue structure. And the distribution of funding for city services. And… well, a whole lot of other things.
The Megadistrict of Neo-Columbia
It’s easy (and perhaps completely useless) to do some napkin math calculations of what DC’s murder rate would be if it included its inner-ring suburbs or near-inner-ring, which are mostly (on average) both quite prosperous and quite densely populated (crazy!).
Neo-DC has about 1.3 million people, between Silver Spring (80k), Bethesda (68k), Wheaton (51k), Takoma Park (18k), and many more. These are all in Montgomery County. Prince George’s County can add more than 80,000 new residents. What’s the crime rate? Montgomery County is around 2-4 murders per 100,000, which is 1/20th to 1/10th that of DC.
Resolving The MAUP
We really cannot resolve the MAUP for DC unless we start counting DC as a unit in conjunction with its immediate neighbors, or perhaps as part of a combined urbanized area. I’m not sure what exactly the value of this would be beyond giving a better picture of crime numbers. It just goes to show that most borders are completely arbitrary things.
That doesn’t mean that we should ignore all borders. We need discrete units through which to quantify, measure, and allocate things. But they are, like most constructs, invention.
In any case, considering the city without understanding how its sui generis spatial geometry skews the statistics is, like the rest of what comes out of this criminal administration, fundamentally misleading and irresponsible.